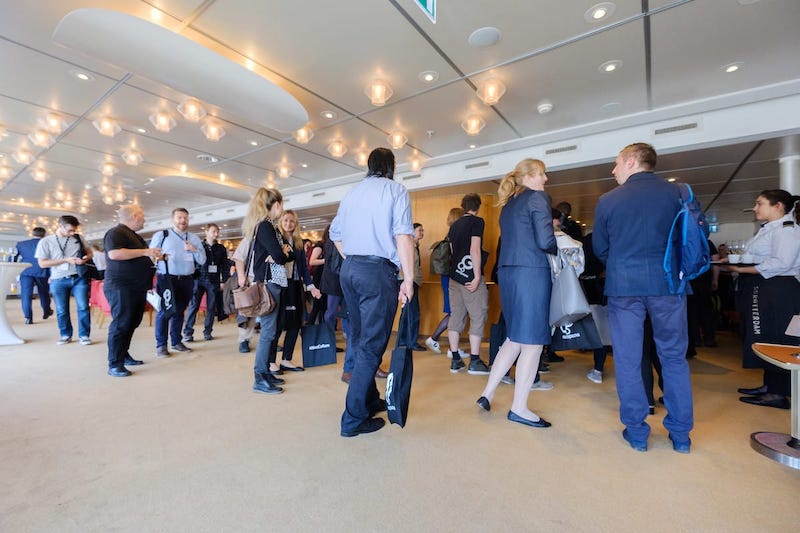
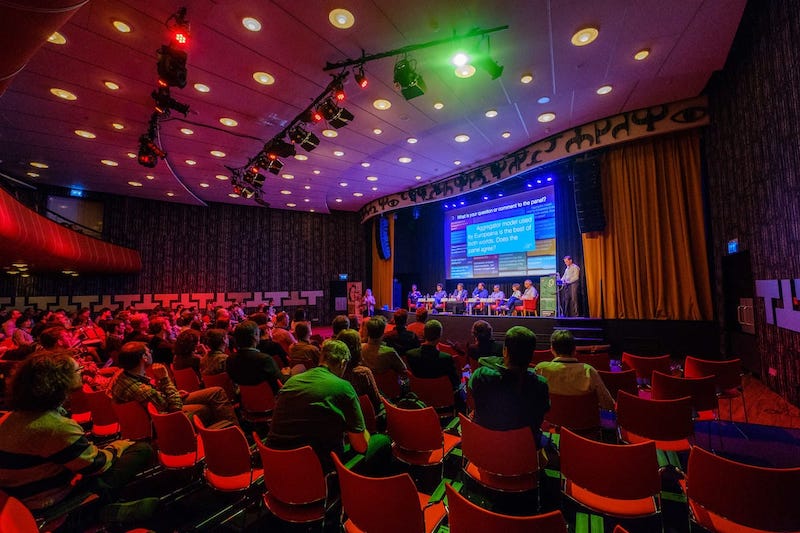
SREday is a worldwide series of community events for engineers who build, ship and run modern software systems. Across cities around the world, we bring together people working in reliability, cloud, DevOps, observability and production engineering to share real-world experience, connect with their local community and explore how these disciplines are evolving in the age of AI.
Today’s observability platforms are often vertically integrated—binding data storage, query, and visualization layers into a single stack. This tight coupling drives up costs, makes integrations painful, and slows teams down. But it doesn’t have to be this way.
In this talk, we’ll explore how SRE teams can benefit from a more modular approach to observability—one inspired by the evolution of Business Intelligence. Just as BI stacks evolved to separate ETL, data warehouses, and dashboards, observability stacks can be designed around clear boundaries: interoperable tools, technology-neutral query layers, and plug-and-play storage.
You’ll learn why decoupled observability architecture is essential for cost control, agility, and tool flexibility—and how to move toward a stack that meets the real-world needs of today’s SRE teams.... Read more

As infrastructure evolves from cost center to innovation engine, the stakes have never been higher. This keynote will unpack the forces reshaping the infrastructure landscape—from the rise of sovereign clouds and liquid cooling to the imperative of secure-by-default systems. Drawing on lessons from Criteo’s own transformation, this talk will highlight how infrastructure leaders must balance sustainability, performance, and security to thrive in a post-cloud, AI-accelerated world. It’s not just about uptime—it’s about impact.... Read more
Production today is messy. There’s noise, complexity, and a constant stream of change. And while we’ve come a long way with observability, it still leans heavily on human foresight. Logs, metrics, alerts, they’re all things we had to think of ahead of time. But when we don’t? That’s where blind spots are born.
Ambient agents try to shift that model. These are always-on, proactive teammates who don’t wait for a prompt. They listen to everything happening in production. They surface things we’d likely miss.
In this talk, we’ll dive into what it takes to bring an ambient agent into your stack, how it listens, learns, and acts, and why this might just be the layer of intelligence your system’s been missing.... Read more
AI is making its way into platform engineering—not just as a workload, but as a smart automation layer for how platforms are built, operated, and optimized. Promises of intelligent autoscaling, self-tuning systems, and AI-assisted remediation are everywhere. But how do these claims hold up in real-world Kubernetes environments?
In this deeply technical session, the latest generation of AI-powered features and patterns will be benchmarked and stress-tested in the context of platform operations. From scaling decisions to observability-driven automation and adaptive infrastructure behavior, the focus will be on how these systems perform under load, how they handle edge cases, and what the operational overhead truly looks like.
Attendees will walk away with a clear-eyed view of the strengths and limitations of AI-driven platforms, grounded in data—not just demos.
Because if your infrastructure says “I’ll be back,” it’s worth knowing what it’s planning.... Read more
Load testing doesn't have to be resource intensive or last minute. We will walk through how to set up a Gatling test, integrate it into CI/CD, and use observability data to make the results actionable. Learn how to add load testing by starting small, staying reliable, and scaling with confidence.... Read more
When planning observability for a distributed system, it's common to avoid having each microservice sending telemetry data directly to the backend. Instead, a Collector is typically deployed per host or node to receive, process, and forward telemetry data.
This approach improves bandwidth usage and centralizes control over telemetry flow. However, it also introduces a critical point of failure: what happens if the Collector crashes after receiving data but before it can forward it to the backend?
In this session, we’ll walk through the most used reliability mechanisms in the OpenTelemetry Collector and their limitations (potential data loss, limited control in fanout scenarios and so on). Then, we’ll introduce a newly added OTLP exporter batching option (distinct from the batch processor), explain why it was needed, how it works, and demonstrate its behavior in a crash-and-recovery scenario together with the exporter helper and persistent queue.... Read more
**Session Overview**
Kubernetes offers many ways to share GPUs, but a single, cluster-wide scheduler often forces trade-offs between utilization, stability, and team autonomy. This talk shows how vCluster makes the NVIDIA Kubernetes AI Scheduler (KAI) run as an opt-in service for each tenant—so platform teams can raise GPU density while keeping operations predictable.
**What We’ll Cover**
- Problem statement – why mixed workloads leave GPUs under-used and complicate on-call
- vCluster fundamentals – lightweight control planes that isolate scheduling logic, not hardware
- KAI at a glance – fractional GPU allocation, gang queues, topology awareness
- Live demonstration – two vClusters on one host
**Key Takeaways**
- A reproducible pattern for running different schedulers side-by-side
- Practical steps to increase GPU utilisation without adding more clusters
- An isolation model that lets teams experiment safely
**Why It Matters**
As GPU demand grows, platform engineers must balance cost efficiency with reliability. Combining vCluster and KAI delivers both—turning idle accelerators into productive capacity while preserving operational control.
```
Want me to also make a **slide-deck version** in Markdown (short bullets, less prose) so you can drop it into a presentation tool?
... Read more
This session explores how Happening completely revamped their edge Kubernetes infrastructure by implementing EKS Hybrid to centrally manage all their on-premise clusters across different markets. Faced with regulatory requirements to store data locally at the edge while maintaining operational efficiency, we designed a sophisticated hybrid architecture with a centralized AWS control plane to manage edge data planes. We'll dive deep into our technical implementation including our mixed-mode CNI setup with VPC-CNI and Cilium, multi-pool IPAM to handle cross-cloud networking, and how we leverage Kyverno policies to ensure workload placement across markets. Learn how we established seamless connectivity between AWS and on-premise environments through Wireguard VPN tunnels, coupled with BGP routing policies to efficiently route edge workloads. By centralizing management of geographically distributed Kubernetes clusters, we've reduced our on-premise management burden by 40%, resulting in substantial cost savings and dramatically decreased the team operational toil. Cluster upgrades which we were always tedious is now done in just a few hours across all environments simultaneously, significantly improving our maintenance windows and capacity management.... Read more
How do you plan for unplanned incidents? You practice with Chaos Engineering. Strong incident response doesn't just happen, you have to build the skills and train your team. Practicing for major incidents gives your team insight into how your applications will behave when something goes wrong as well as how the team will interact to solve problems. Combining your Incident Response practices with Chaos Engineering roots your response practice in real-world scenarios, helping your team build confidence.... Read more
Traditional syslog systems have long been opaque — exporting minimal, fixed-format metrics that rarely reflect what users actually care about. AxoSyslog, a high-performance fork of syslog-ng, has taken a different path: not only adopting native Prometheus metrics, but also enabling metric emission directly from the user’s log processing logic.
In this talk, I’ll share how we transitioned from CSV-style global and per-driver metrics to full Prometheus integration. But more importantly, I’ll explore a less common mindset: treating metrics not as static artifacts of a system, but as programmable, user-defined views of what matters. Users can emit fine-grained, label-rich metrics from log routing logic itself — for example, tracking per-tenant message volume, labeling metrics with custom log or environment related info, or observing how often certain fields are missing.
We’ll walk through: * What syslog metrics looked like historically (and why they fell short). * Our journey to integrating Prometheus natively. * How update_metric() works and why it's powerful. * Real-world use cases where dynamic metrics made debugging and policy enforcement dramatically easier.
If you want to make observability accessible in deeply traditional parts of the stack — or want to let users code their own metrics — this talk is for you.... Read more
17:00
Wrap up
Scan each other's QR codes & head to a nearby pub!
Setting up continuous integration is now a common practice in the industry. However, there are still only few effective solutions for doing so across hundreds of repositories encompassing thousands of projects. How do we manage dependencies between projects? How do we assess the quality of each one? How do we automate the validation of a project's clients even before merging a pull request? In this session, we’ll quickly revisit the fundamentals of the problem. Then, we’ll share Criteo's own journey on this topic, along with the pros and cons of the different approaches we explored.... Read more
In modern distributed systems, the volume and fragmentation of production data can easily and frequently overwhelm human operators. This talk introduces a LangChain agent built to autonomously investigate production issues by orchestrating multiple tools across organizations’ stacks. We'll walk through how to build a modular, composable multi-tool agent, dig deeper into real-world reliability challenges, and share strategies and lessons learned in making these agents production-ready.... Read more
Containers are immutable by design making Kubernetes the standard execution platorm for stateless workloads.
We do see more and Statefull applications designed for Kubernetes like Databasaes and Jobs. But it still comes with some challenges.
What about a long running process that you want to migrate from one node to another without loosing any processing time?
With Container Live Migration a Statefull Minecraft process can be migrated from one node to another without any visible interruption https://www.youtube.com/watch?v=LveOlly1ajA&t=4s.
Similarly, you can migrate a long running job to a new machine when you need to perform maintenance activities on your worker node.
Join our session to learn how Live Migration can reduce toil, improve uptime and save costs.... Read more
This talk introduces telemetry as code**: bringing the same declarative principles that transformed infrastructure to your observability stack.
Using **OpenTelemetry Collector Custom Resources** and the **Telemetry Controller**, we'll demonstrate how to eliminate configuration drift, enable true multi-tenancy, and make observability as reliable and repeatable as your deployments.
---
**What You'll Learn**
**Transform Your Telemetry Pipeline**
- Replace brittle YAML with declarative Kubernetes CRDs that abstract complexity while maintaining flexibility
- Build tenant-aware routing that scales from single teams to enterprise-wide deployments
**Master Production Patterns**
- Design secure, multi-tenant Prometheus integration using Remote Write protocols
- Leverage automated configuration validation and testing strategies that catch issues before production
- Navigate the hidden complexities of cross-namespace telemetry routing and security
**Avoid Costly Mistakes**
- Learn battle-tested approaches for managing collector configurations across diverse environments
... Read more
Most organizations adopt CDNs or HTTP caching proxies to boost the performance and scalability of their web platforms. But there’s another powerful advantage that often goes underused: centralized observability.
This presentation will demonstrate how to go beyond the traditional performance benefits of a caching proxy like Varnish and turn it into a rich observability layer. You’ll learn how to unlock and extend the valuable metrics and logs already flowing through your proxy, and how to integrate them with tools like Prometheus, Loki, and Grafana. We’ll also cover how to bring consistency to your observability stack by standardizing metrics, logs, and traces with OpenTelemetry.
Since caching proxies and CDNs are designed to shield your origin servers from most requests, they become the most complete and reliable source of traffic insights. This session will show you how to take full advantage of that unique position—turning your proxy into both a performance accelerator and an essential source of observability insights.... Read more
OpenTelemetry Semantic conventions cover many layers of your stack but fall flat when it comes to business logic. But this doesn’t have to be the case! The OpenTelemetry Weaver project gives you the tools to build your own semantic conventions. With auto generated instrumentation libraries and documentation, developers no longer have to worry about whether an attribute is called customer_id, customerID, accountNumber or something completely different - it’s all in the schema! Built-in support for policy validation also ensures your alerts never break because a metric has been renamed.... Read more
At Criteo, we’ve relied on automatic aggregations for years. “Automatic aggregation” is the name we give to a system of recording rules that matches most metrics and removes certain dimensions, such as the instance emitting the metric, to reduce the cardinality (i.e. the number of metrics) and thus making queries faster.
What started as a workaround has become a key part of how we ensure backend stability and reliability at scale, with hundreds of millions of active metrics, all without requiring users to write a single recording rule. It also significantly reduces the cost of metrics storage. Internally, we call this approach zero-effort Observability, as most teams don’t have to write/maintain recording rules.
In this talk, I’ll walk through how our approach to automatic aggregations has evolved over time, and how we’ve adapted it to fit naturally into our Prometheus-based stack. I’ll share the different implementations we’ve tried, the lessons we’ve learned, and how our latest version takes advantage of recent improvements in Prometheus (new type label) .... Read more
How many times were you woken up during the night to either spend more time than you would like trying to figure out what exactly broke, or just bash your keyboard in frustration once you figure out it was actually a false positive? What if there was a better way? I mean, AI is everywhere nowadays, what if we used it to solve these problems? Let's talk about AIOps and, through real-world case studies and industry research, see why it enables companies to reduce their MTTR by 62%, cut their alert noise by 91%, and predict 87% of potential service degradations — before they impact customers. We will take a journey through the evolution of AIOps: from early AI analytics, to the rise of GenAI, and taking us to the latest promised savior: Agents. But how do Agents help us when incidents come to knock? Will they speed us up? Are they even able to fix incidents without having to wake us up? And even if Agents are here to change everything, where are the gaps? Can everything be "agentified"?... Read more
The network the metaphorical plumbing through which all your precious non-metaphorical observability and monitoring data flows; it holds secrets you'll never find anywhere else. And it's more important today than ever before.... Read more
This talk presents the real-world story behind countX, a B2B fintech company that grew from first commit to successful private equity exit in under four years, without VC funding and with a lean, empowered team. From day one, we built on a fully serverless AWS-native architecture: Lambda, SNS/SQS, API Gateway, CloudFront, Cognito, and CDK. On top of that, we implemented a Continuous Deployment pipeline using GitHub, CodeBuild, and CodePipeline, enabling us to deploy to production dozens of times per week with high confidence and zero manual gates.
But the talk isn’t just about architecture or tooling. What made this setup truly powerful was how we paired CD with Continuous Discovery - customer interviews, fake doors, lightweight A/B tests, and KPIs tied to actual product outcomes. This combination created a feedback-driven loop that allowed us to ship fast, iterate with purpose, and align engineering with business goals.
The main takeaway: how a pure DevOps practice like Continuous Deployment, when paired with the right product mindset, can significantly increase not just delivery velocity, but team performance, product-market fit, and ultimately revenue and ROI. This is not a theoretical or aspirational talk, it’s a practical case study showing how modern SRE practices can become strategic drivers of business success.... Read more
Machine Learning (ML) solutions often start on a simple platform like a virtual machine, which is great for initial research. However, as the system scales and enters production, automation becomes crucial. Cloud suites such as Google Vertex AI, Azure Machine Learning, and AWS Sagemaker, can streamline this process.
For example, model training is more efficient with a managed service that automatically scales compute resources based on your training needs, eliminating the cost of idle resources –- as happens when you use the Jupyter Notebook or a VM alone for training.
We’ll cover all parts of the ML process, including development, hypertuning, deployment for inference, experiments, model management, monitoring, performance, and operating the entire pipeline.... Read more
17:30
Wrap up
Scan each other's QR codes & head to a nearby pub!
I’ll Be Backoff: Benchmarking AI-Powered Platform Engineering Tools
Abstract
AI is making its way into platform engineering—not just as a workload, but as a smart automation layer for how platforms are built, operated, and optimized. Promises of intelligent autoscaling, self-tuning systems, and AI-assisted remediation are everywhere. But how do these claims hold up in real-world Kubernetes environments?
In this deeply technical session, the latest generation of AI-powered features and patterns will be benchmarked and stress-tested in the context of platform operations. From scaling decisions to observability-driven automation and adaptive infrastructure behavior, the focus will be on how these systems perform under load, how they handle edge cases, and what the operational overhead truly looks like.
Attendees will walk away with a clear-eyed view of the strengths and limitations of AI-driven platforms, grounded in data—not just demos.
Because if your infrastructure says “I’ll be back,” it’s worth knowing what it’s planning.
Bio
Annie Talvasto is an award-winning international technology speaker and leader. She has spoken at over 100+ tech events worldwide, including KubeCon + CloudNativeCon and Microsoft Build & Ignite. She has been recognized with the CNCF Ambassador, Azure & AI Platform MVP awards. She has co-organized the Kubernetes & CNCF Finland meetup since 2017. In the past, she has also served as a track chair for KubeCon + CloudNativeCon, Program Chair for Secure AI Summit (powered by Cloud Native) and has been hosting Cloud Native Live, a weekly livestream by CNCF, since 2021.
Heather Thacker
Gatling
Getting Started with Reliable Load Testing
Abstract
Load testing doesn't have to be resource intensive or last minute. We will walk through how to set up a Gatling test, integrate it into CI/CD, and use observability data to make the results actionable. Learn how to add load testing by starting small, staying reliable, and scaling with confidence.
Bio
Developer Advocate with a background in software engineering.
Juliano Costa & Yuri Oliveira Sa
Datadog & OllyGarden
Crash-Proofing Your OpenTelemetry Collector
Abstract
When planning observability for a distributed system, it's common to avoid having each microservice sending telemetry data directly to the backend. Instead, a Collector is typically deployed per host or node to receive, process, and forward telemetry data.
This approach improves bandwidth usage and centralizes control over telemetry flow. However, it also introduces a critical point of failure: what happens if the Collector crashes after receiving data but before it can forward it to the backend?
In this session, we’ll walk through the most used reliability mechanisms in the OpenTelemetry Collector and their limitations (potential data loss, limited control in fanout scenarios and so on). Then, we’ll introduce a newly added OTLP exporter batching option (distinct from the batch processor), explain why it was needed, how it works, and demonstrate its behavior in a crash-and-recovery scenario together with the exporter helper and persistent queue.
Bio
Juliano Costa is a Developer Advocate at Datadog with a focus on OpenTelemetry. He is a CNCF Ambassador passionate about fostering the Cloud Native community and spreading OTel's word everywhere he goes. Juliano is an active contributor to the OpenTelemetry project and a maintainer on the OpenTelemetry Demo, as well as a member of the Developer Experience SIG.
When he's not talking about OTel, you'll find him chasing after his energetic 2-year-old.
Piotr Zaniewski
vCluster
Instant KAI Sandboxes with vCluster: Multi-Tenant, Multi-Scheduler GPU Sharing
Abstract
Session Overview
Kubernetes offers many ways to share GPUs, but a single, cluster-wide scheduler often forces trade-offs between utilization, stability, and team autonomy. This talk shows how vCluster makes the NVIDIA Kubernetes AI Scheduler (KAI) run as an opt-in service for each tenant—so platform teams can raise GPU density while keeping operations predictable.
What We’ll Cover
- Problem statement – why mixed workloads leave GPUs under-used and complicate on-call
- vCluster fundamentals – lightweight control planes that isolate scheduling logic, not hardware
- KAI at a glance – fractional GPU allocation, gang queues, topology awareness
- Live demonstration – two vClusters on one host
Key Takeaways
- A reproducible pattern for running different schedulers side-by-side
- Practical steps to increase GPU utilisation without adding more clusters
- An isolation model that lets teams experiment safely
Why It Matters
As GPU demand grows, platform engineers must balance cost efficiency with reliability. Combining vCluster and KAI delivers both—turning idle accelerators into productive capacity while preserving operational control.
```
Want me to also make a slide-deck version in Markdown (short bullets, less prose) so you can drop it into a presentation tool?
Bio
An active contributor to OpenSource projects on GitHub, blogger and content creator, focusing on practical, scalable solutions in cloud-native environments. DevOps and Platform Engineering practitioner and advocate. Visit: cloudrumble.net
Laurent Godet
Happening
Orchestrating the Edge: A Hybrid Kubernetes Journey
Abstract
This session explores how Happening completely revamped their edge Kubernetes infrastructure by implementing EKS Hybrid to centrally manage all their on-premise clusters across different markets. Faced with regulatory requirements to store data locally at the edge while maintaining operational efficiency, we designed a sophisticated hybrid architecture with a centralized AWS control plane to manage edge data planes. We'll dive deep into our technical implementation including our mixed-mode CNI setup with VPC-CNI and Cilium, multi-pool IPAM to handle cross-cloud networking, and how we leverage Kyverno policies to ensure workload placement across markets. Learn how we established seamless connectivity between AWS and on-premise environments through Wireguard VPN tunnels, coupled with BGP routing policies to efficiently route edge workloads. By centralizing management of geographically distributed Kubernetes clusters, we've reduced our on-premise management burden by 40%, resulting in substantial cost savings and dramatically decreased the team operational toil. Cluster upgrades which we were always tedious is now done in just a few hours across all environments simultaneously, significantly improving our maintenance windows and capacity management.
Bio
Laurent Godet is a seasoned Site Reliability Engineer with nearly a decade of experience building and scaling cloud-native infrastructure for high-growth companies. Currently at Happening, he focuses on reliability, automation, and scalable systems design.
Previously, Laurent led SRE initiatives at LiveRamp, where he managed the company’s largest Kubernetes cluster on GKE, introduced GitOps best practices, and built the award-winning Tenant Factory service that reduced onboarding time from a full day to just one hour.
His career spans pivotal DevOps and SRE roles at Earnd (Greensill), iov42, and Babylon Health, where he drove cloud migrations, built high-availability platforms, and implemented modern observability and CI/CD pipelines. Laurent’s expertise lies in Kubernetes, AWS, serverless architectures, and data-intensive systems, always with a focus on reliability, scalability, and developer productivity.
Daniel Afonso
PagerDuty
Plan for Unplanned Work: Game Days with Chaos Engineering
Abstract
How do you plan for unplanned incidents? You practice with Chaos Engineering. Strong incident response doesn't just happen, you have to build the skills and train your team. Practicing for major incidents gives your team insight into how your applications will behave when something goes wrong as well as how the team will interact to solve problems. Combining your Incident Response practices with Chaos Engineering roots your response practice in real-world scenarios, helping your team build confidence.
Bio
Daniel Afonso is a Senior Developer Advocate at PagerDuty, SolidJS DX team member, Instructor at Egghead.io, and Author of State Management with React Query. Daniel has a full-stack background, having worked with different languages and frameworks on various projects from IoT to Fraud Detection. He is passionate about learning and teaching and has spoken at multiple conferences around the world about topics he loves. In his free time, when he's not learning new technologies or writing about them, he's probably reading comics or watching superhero movies and shows.
Attila Szakacs
Axoflow
Counting What You Care About in Your Security Data Pipeline
Abstract
Traditional syslog systems have long been opaque — exporting minimal, fixed-format metrics that rarely reflect what users actually care about. AxoSyslog, a high-performance fork of syslog-ng, has taken a different path: not only adopting native Prometheus metrics, but also enabling metric emission directly from the user’s log processing logic.
In this talk, I’ll share how we transitioned from CSV-style global and per-driver metrics to full Prometheus integration. But more importantly, I’ll explore a less common mindset: treating metrics not as static artifacts of a system, but as programmable, user-defined views of what matters. Users can emit fine-grained, label-rich metrics from log routing logic itself — for example, tracking per-tenant message volume, labeling metrics with custom log or environment related info, or observing how often certain fields are missing.
We’ll walk through: * What syslog metrics looked like historically (and why they fell short). * Our journey to integrating Prometheus natively. * How update_metric() works and why it's powerful. * Real-world use cases where dynamic metrics made debugging and policy enforcement dramatically easier.
If you want to make observability accessible in deeply traditional parts of the stack — or want to let users code their own metrics — this talk is for you.
Bio
Founding Engineer at Axoflow, leading the dataplane team, specializing in scalable log ingestion and processing pipelines for enterprise and cloud-native environments.
Longtime syslog-ng and AxoSyslog developer with a strong passion for open source and community-driven innovation. Focused on building reliable, high-performance log management and observability systems that address real-world operational challenges.
Bence Csati
Axoflow
Telemetry as Code: Declarative Observability with OpenTelemetry
Abstract
This talk introduces telemetry as code**: bringing the same declarative principles that transformed infrastructure to your observability stack.
Using OpenTelemetry Collector Custom Resources and the Telemetry Controller, we'll demonstrate how to eliminate configuration drift, enable true multi-tenancy, and make observability as reliable and repeatable as your deployments.
What You'll Learn
Transform Your Telemetry Pipeline
- Replace brittle YAML with declarative Kubernetes CRDs that abstract complexity while maintaining flexibility
- Build tenant-aware routing that scales from single teams to enterprise-wide deployments
Master Production Patterns
- Design secure, multi-tenant Prometheus integration using Remote Write protocols
- Leverage automated configuration validation and testing strategies that catch issues before production
- Navigate the hidden complexities of cross-namespace telemetry routing and security
Avoid Costly Mistakes
- Learn battle-tested approaches for managing collector configurations across diverse environments
Bio
Passionate Software Engineer who loves building reliable systems and actively engages with the cloud-native community to advance Kubernetes security and observability. Maintainer of multiple CNCF sandbox projects, including Bank-Vaults, which is a project dedicated to simplifying the complex world of secret management. The Logging operator, which solves logging-related problems in Kubernetes environments.
Currently, working on the Logging operator and the new Telemetry controller at Axoflow.
Thijs Feryn
Varnish Software
Leveraging the edge for observability
Abstract
Most organizations adopt CDNs or HTTP caching proxies to boost the performance and scalability of their web platforms. But there’s another powerful advantage that often goes underused: centralized observability.
This presentation will demonstrate how to go beyond the traditional performance benefits of a caching proxy like Varnish and turn it into a rich observability layer. You’ll learn how to unlock and extend the valuable metrics and logs already flowing through your proxy, and how to integrate them with tools like Prometheus, Loki, and Grafana. We’ll also cover how to bring consistency to your observability stack by standardizing metrics, logs, and traces with OpenTelemetry.
Since caching proxies and CDNs are designed to shield your origin servers from most requests, they become the most complete and reliable source of traffic insights. This session will show you how to take full advantage of that unique position—turning your proxy into both a performance accelerator and an essential source of observability insights.
Bio
As the Technical Evangelist at Varnish Software, Thijs Feryn focuses on web performance, software scalability, and content delivery. He demonstrates content-driven and technical messaging through presentations, videos, books, blog posts, social media posts, podcasts, and other media.
Thijs is a published author and wrote Getting Started with Varnish Cache and Varnish 6 by Example. As a public speaker, he has a track record of over 300 presentations in 22 countries, where he is often praised for his energetic and engaging presentation style.
As an evangelist, Thijs is also active in many open-source communities, most notably the Varnish and PHP community. He has contributed to various communities for over 15 years both technically and as an organizer and facilitator.
Prior to joining Varnish Software, Thijs Feryn spent 15 years in the web hosting industry, tackling web performance and scalability issues on a daily basis and evangelizing these topics.
Dominik Süß
Grafana Labs
Schema driven Observability with OpenTelemetry Weaver
Abstract
OpenTelemetry Semantic conventions cover many layers of your stack but fall flat when it comes to business logic. But this doesn’t have to be the case! The OpenTelemetry Weaver project gives you the tools to build your own semantic conventions. With auto generated instrumentation libraries and documentation, developers no longer have to worry about whether an attribute is called customer_id, customerID, accountNumber or something completely different - it’s all in the schema! Built-in support for policy validation also ensures your alerts never break because a metric has been renamed.
Bio
Dominik started his journey in technology as an SRE, working on projects ranging from warehouse logistics and photobook designers to analyzing satellite imagery. During this time, he discovered his passion for developer tooling and making sure developers can focus on what they do best - build great software!
Now he is working as a Developer Experience Engineer at Grafana Labs, building tools to see clearly in the ever-changing world of software.
Raphael Bizos
Criteo
A History of Automatic Aggregations
Abstract
At Criteo, we’ve relied on automatic aggregations for years. “Automatic aggregation” is the name we give to a system of recording rules that matches most metrics and removes certain dimensions, such as the instance emitting the metric, to reduce the cardinality (i.e. the number of metrics) and thus making queries faster.
What started as a workaround has become a key part of how we ensure backend stability and reliability at scale, with hundreds of millions of active metrics, all without requiring users to write a single recording rule. It also significantly reduces the cost of metrics storage. Internally, we call this approach zero-effort Observability, as most teams don’t have to write/maintain recording rules.
In this talk, I’ll walk through how our approach to automatic aggregations has evolved over time, and how we’ve adapted it to fit naturally into our Prometheus-based stack. I’ll share the different implementations we’ve tried, the lessons we’ve learned, and how our latest version takes advantage of recent improvements in Prometheus (new type label) .
Bio
Raphael Bizos is a Senior Site Reliability Engineer at Criteo, where he has spent the past six years designing, scaling, and operating large-scale systems. Before joining Criteo, he spent over five years at the French Ministry of the Interior, first as a software engineer and later as a Lead Developer managing a team of four and shaping the architecture of several key applications. With deep experience in Python, asynchronous systems, and REST API development, Raphael brings a blend of hands-on engineering, technical leadership, and a strong focus on reliable, maintainable infrastructure.
Daniel Afonso
PagerDuty
The State of AI in Incident Management
Abstract
How many times were you woken up during the night to either spend more time than you would like trying to figure out what exactly broke, or just bash your keyboard in frustration once you figure out it was actually a false positive? What if there was a better way? I mean, AI is everywhere nowadays, what if we used it to solve these problems? Let's talk about AIOps and, through real-world case studies and industry research, see why it enables companies to reduce their MTTR by 62%, cut their alert noise by 91%, and predict 87% of potential service degradations — before they impact customers. We will take a journey through the evolution of AIOps: from early AI analytics, to the rise of GenAI, and taking us to the latest promised savior: Agents. But how do Agents help us when incidents come to knock? Will they speed us up? Are they even able to fix incidents without having to wake us up? And even if Agents are here to change everything, where are the gaps? Can everything be "agentified"?
Bio
Daniel Afonso is a Senior Developer Advocate at PagerDuty, SolidJS DX team member, Instructor at Egghead.io, and Author of State Management with React Query. Daniel has a full-stack background, having worked with different languages and frameworks on various projects from IoT to Fraud Detection. He is passionate about learning and teaching and has spoken at multiple conferences around the world about topics he loves. In his free time, when he's not learning new technologies or writing about them, he's probably reading comics or watching superhero movies and shows.
Leon Adato
Catchpoint
Network Observability Overlooked, Underappreciated, and More Important Than Ever
Abstract
The network the metaphorical plumbing through which all your precious non-metaphorical observability and monitoring data flows; it holds secrets you'll never find anywhere else. And it's more important today than ever before.
In my sordid career, I have been an actor, bug exterminator and wild-animal remover (nothing crazy like pumas or wildebeests. Just skunks, snakes, and raccoons.), electrician, carpenter, stage-combat instructor, ASL interpreter, and Sunday school teacher. Oh, yeah, I've also worked with computers.
While my first keyboard was an IBM selectric, and my first digital experience was on an Atari 400, my professional work in tech started in 1989 (when you got Windows 286 for free on twelve 5¼” when you bought Excel 1.0). Since then I've worked as a classroom instructor, courseware designer, helpdesk operator, desktop support staff, sysadmin, network engineer, and software distribution technician.
Then, about 25 years ago, I got involved with monitoring. I've worked with a wide range of tools: Tivoli, BMC, OpenView, janky perl scripts, Nagios, SolarWinds, DOS batch files, Zabbix, Grafana, New Relic, and other assorted nightmare fuel. I've designed solutions for companies that were modest (~10 systems), significant (5,000 systems), and ludicrous (250,000 systems). In that time, I've learned a lot about monitoring and observability in all it's many and splendid forms.
Dima Malyshenko
countX GmbH
From Git Push to Exit: How Continuous Deployment Converted into Financial Success
Abstract
This talk presents the real-world story behind countX, a B2B fintech company that grew from first commit to successful private equity exit in under four years, without VC funding and with a lean, empowered team. From day one, we built on a fully serverless AWS-native architecture: Lambda, SNS/SQS, API Gateway, CloudFront, Cognito, and CDK. On top of that, we implemented a Continuous Deployment pipeline using GitHub, CodeBuild, and CodePipeline, enabling us to deploy to production dozens of times per week with high confidence and zero manual gates.
But the talk isn’t just about architecture or tooling. What made this setup truly powerful was how we paired CD with Continuous Discovery - customer interviews, fake doors, lightweight A/B tests, and KPIs tied to actual product outcomes. This combination created a feedback-driven loop that allowed us to ship fast, iterate with purpose, and align engineering with business goals.
The main takeaway: how a pure DevOps practice like Continuous Deployment, when paired with the right product mindset, can significantly increase not just delivery velocity, but team performance, product-market fit, and ultimately revenue and ROI. This is not a theoretical or aspirational talk, it’s a practical case study showing how modern SRE practices can become strategic drivers of business success.
Bio
I’m a Ukrainian entrepreneur, software engineer by background, with over 20 years of experience. I started my career in Kyiv, spent several years working in Moscow, and have spent the last decade in Berlin. Most recently, I was the co-founder and CTO of countX, a B2B fintech company that went from first commit to a successful exit in under four years. I’m also pursuing an Executive MBA at London Business School, where I’m deepening my focus on fintech, financial systems, and venture strategy.
Joshua Fox
DoiT International
Growing Machine Learning to production: Cloud MLOps for speed and efficiency
Abstract
Machine Learning (ML) solutions often start on a simple platform like a virtual machine, which is great for initial research. However, as the system scales and enters production, automation becomes crucial. Cloud suites such as Google Vertex AI, Azure Machine Learning, and AWS Sagemaker, can streamline this process.
For example, model training is more efficient with a managed service that automatically scales compute resources based on your training needs, eliminating the cost of idle resources –- as happens when you use the Jupyter Notebook or a VM alone for training.
We’ll cover all parts of the ML process, including development, hypertuning, deployment for inference, experiments, model management, monitoring, performance, and operating the entire pipeline.
Bio
Joshua Fox has 20 years experience as a software architect in software product companies, and now advises tech companies on their gnarliest cloud challenges as a senior cloud architect at DoiT International. See more at joshuafox.com/publications
Kyle Hoondert
Imply
KeynoteWhat Observability Can Learn From BI: Decoupling for Speed, Scale, and Flexibility
Abstract
Today’s observability platforms are often vertically integrated—binding data storage, query, and visualization layers into a single stack. This tight coupling drives up costs, makes integrations painful, and slows teams down. But it doesn’t have to be this way.
In this talk, we’ll explore how SRE teams can benefit from a more modular approach to observability—one inspired by the evolution of Business Intelligence. Just as BI stacks evolved to separate ETL, data warehouses, and dashboards, observability stacks can be designed around clear boundaries: interoperable tools, technology-neutral query layers, and plug-and-play storage.
You’ll learn why decoupled observability architecture is essential for cost control, agility, and tool flexibility—and how to move toward a stack that meets the real-world needs of today’s SRE teams.
Bio
Kyle Hoondert is a Customer Architect at Imply, where he helps teams build and run fast, reliable analytics applications that handle massive real time and batch data at scale. Over his five plus years at Imply, he has served in multiple technical leadership roles including Lead Solutions Architect and Senior Sales Engineer, supporting customers across EMEA and beyond. Before Imply, Kyle spent more than a decade at Hitachi Vantara as a Specialist Solutions Architect and Senior Technical Consultant, following earlier roles in systems, storage and infrastructure engineering. He brings deep experience in distributed systems, data platforms and customer focused solution design.
Matthieu Blumberg
Criteo
KeynoteThe Infrastructure Renaissance: Security, Sustainability, and Scale
Abstract
As infrastructure evolves from cost center to innovation engine, the stakes have never been higher. This keynote will unpack the forces reshaping the infrastructure landscape—from the rise of sovereign clouds and liquid cooling to the imperative of secure-by-default systems. Drawing on lessons from Criteo’s own transformation, this talk will highlight how infrastructure leaders must balance sustainability, performance, and security to thrive in a post-cloud, AI-accelerated world. It’s not just about uptime—it’s about impact.
Bio
Matthieu Blumberg is Senior Vice President of Engineering at Criteo, where he leads Infrastructure, Security, and Internal IT initiatives to drive business transformation and empower teams with a world-class digital workplace. With over 14 years at Criteo and a strong background in engineering leadership and cybersecurity, Matthieu plays a key role in scaling technology platforms and ensuring the integrity and efficiency of global operations.
Poone Mokari
Ewake.ai
KeynoteListen to Production the Way It Deserves
Abstract
Production today is messy. There’s noise, complexity, and a constant stream of change. And while we’ve come a long way with observability, it still leans heavily on human foresight. Logs, metrics, alerts, they’re all things we had to think of ahead of time. But when we don’t? That’s where blind spots are born.
Ambient agents try to shift that model. These are always-on, proactive teammates who don’t wait for a prompt. They listen to everything happening in production. They surface things we’d likely miss.
In this talk, we’ll dive into what it takes to bring an ambient agent into your stack, how it listens, learns, and acts, and why this might just be the layer of intelligence your system’s been missing.
Bio
Pooné Mokari is the CEO and co-founder of Ewake.ai, an AI Reliability Teammate on a mission to bring real peace of mind to engineering teams. Drawing on her experience as an SRE at Criteo, she founded Ewake to offer engineers their dream teammate, which investigates issues reactively and watches production proactively. Throughout her career, she was active as a speaker in different tech conferences, such as Devoxx Belgium and Devoxx France. She’s also been engaged in mentoring women in tech.
Emmanuel Guérin
Criteo
KeynoteDependencies galore: Behind the scenes of large-scale multi-repository CI
Abstract
Setting up continuous integration is now a common practice in the industry. However, there are still only few effective solutions for doing so across hundreds of repositories encompassing thousands of projects. How do we manage dependencies between projects? How do we assess the quality of each one? How do we automate the validation of a project's clients even before merging a pull request? In this session, we’ll quickly revisit the fundamentals of the problem. Then, we’ll share Criteo's own journey on this topic, along with the pros and cons of the different approaches we explored.
Bio
Emmanuel Guérin is a Staff Site Reliability Engineer at Criteo. Over the past 25 years, he has been a strong advocate for automation, working with a number of small French startups. Frustrated by the lack of progress as an individual contributor, he continued to champion better practices wherever he could. At Criteo, he has helped scale the primary build system used by the R&D organization. He now focuses on the company’s main scheduler for data jobs.
Tomaz Medrado
Ewake.ai
KeynoteProduction-Ready LangChain Agents - Multi-Tool Architectures for SRE Investigations
Abstract
In modern distributed systems, the volume and fragmentation of production data can easily and frequently overwhelm human operators. This talk introduces a LangChain agent built to autonomously investigate production issues by orchestrating multiple tools across organizations’ stacks. We'll walk through how to build a modular, composable multi-tool agent, dig deeper into real-world reliability challenges, and share strategies and lessons learned in making these agents production-ready.
Bio
Tomaz is the Founding Engineer at Ewake.ai, working actively on advancing Ewake’s mission of building an AI teammate that brings peace of mind to engineering teams by investigating issues reactively and watching production proactively.
Prior to that, Tomaz worked as a Software Engineer for Doctolib, Benie Saúde, and Abbiamo in Brazil.
Jerome Baude
CAST AI
KeynoteOptimizing Kubernetes with Container Live Migration
Abstract
Containers are immutable by design making Kubernetes the standard execution platorm for stateless workloads.
We do see more and Statefull applications designed for Kubernetes like Databasaes and Jobs. But it still comes with some challenges.
What about a long running process that you want to migrate from one node to another without loosing any processing time?
With Container Live Migration a Statefull Minecraft process can be migrated from one node to another without any visible interruption https://www.youtube.com/watch?v=LveOlly1ajA&t=4s.
Similarly, you can migrate a long running job to a new machine when you need to perform maintenance activities on your worker node.
Join our session to learn how Live Migration can reduce toil, improve uptime and save costs.
Bio
Jerome works as a Field Engineer at CAST AI, Application Performance Automation. Prior to that, Jerome worked for different Cloud Native organizations like Docker and HashiCorp.